Screen Shots Of Full Version : 7. Statistical Charts
Here you can display statistical charts, the selection criteria used here won't affect the criteria in tab ![[3] View Orders](Dir_Biz_Manager_Pictures/Tab_[3]_View_Orders.png) If you have a lot of orders, when the program first starts, the selection fields might be inactive(dim), that means it's loading the data, just wait for a few seconds.
In Private Mode, Profit,
If you press the Esc Key to get into the Public Mode, the Balance, Press the Esc Key again to get back into Private Mode. |
|
 |
The smallest unit in bar chart is "day", each vertical bar represents a day. Each order in that day is in a different color. The height of each order is proportional to its value. Each pie chart is displayed under it's selection criteria, as shown on the left, since we are now looking at Aug. of 2006, only one month is selected, we will only see one color in the pie chart representing the selected month. |
 |
The selection criteria values here were entered in tab ![[2] Enter Orders](Dir_Biz_Manager_Pictures/Tab_[2]_Enter_Orders.png) when orders were created. when orders were created.
|
 |
This is showing one year's statistics. |
 |
Here we are looking at 15 years' of order statistics from one customer. Now in Private Mode, you can see "Profit" information. |
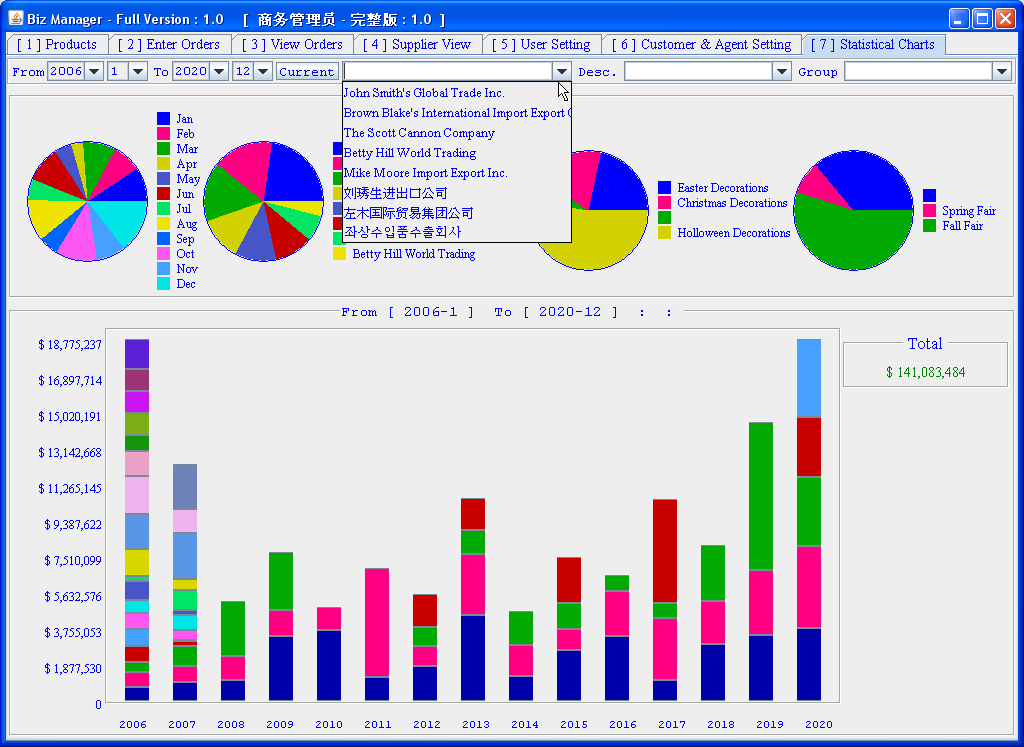 |
Company names in the dropdown list are from the selected orders. In Public Mode, "Profit" info is hidden. |
 |
The largest bar chart unit is "year", here each vertical bar represents a year's orders, each order has a different color, it's height is proportional to it value. |
 |
When you mouse over an order, you will see it's details. Since it's in Private Mode now, you can see all info. Try it in Public Mode, supplier name and profit will be hidden. |
 |
Even when displaying by day, you can still mouse over an order to see it's details. Since it's in Private Mode now, you can see all info. Try it in Public Mode, supplier name and profit will be hidden. |
 ,
,  and
and  info will be shown.
 ,
,  and
and  info will be shown.
Copyright © 2006 Ni , Min ( Frank ). All rights reserved.